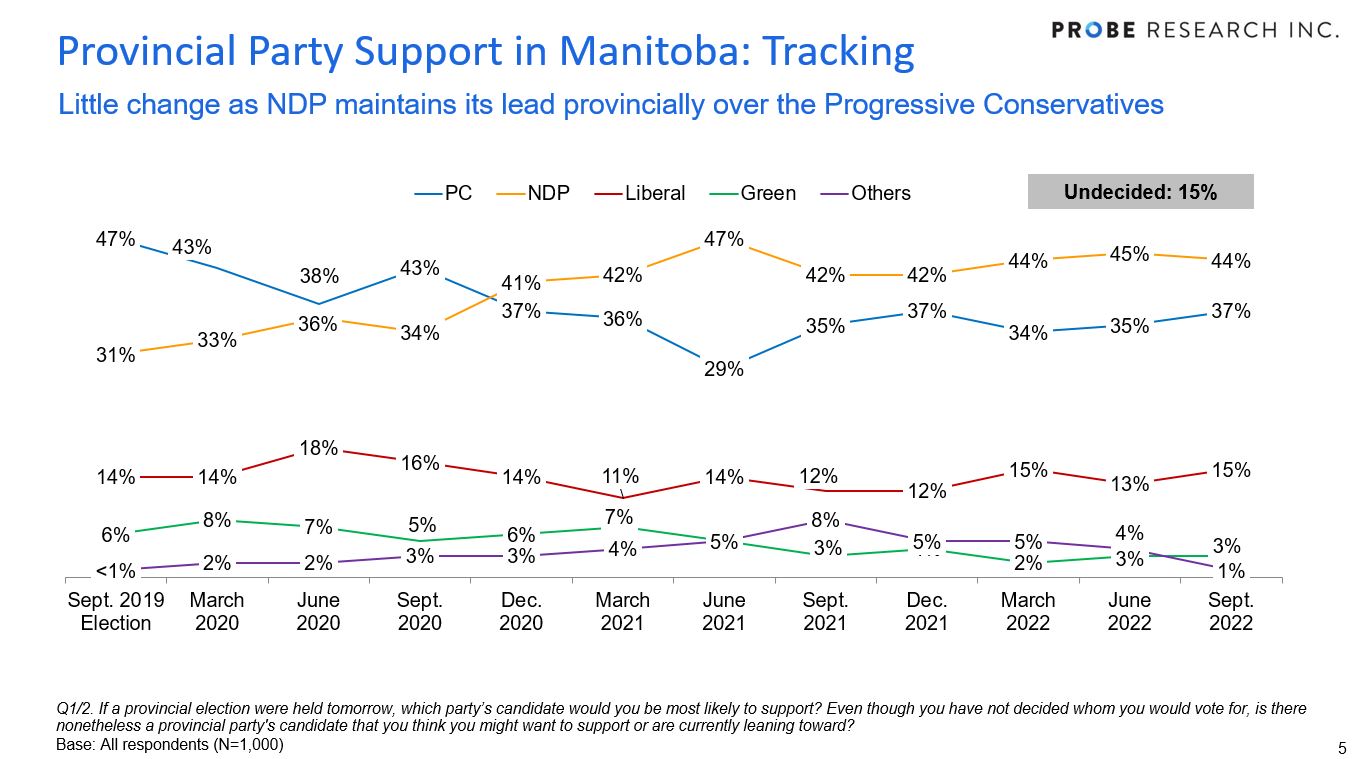
Provincial voting preferences remain practically unchanged in Manitoba, with the NDP’s lead over the Progressive Conservatives remaining consistent since June 2022. Province-wide, 44 per cent would cast ballots for a NDP candidate in their constituency (-1 percentage points vs. June), with 37 per cent now preferring the governing PCs (+2 points). Support for the third-place Manitoba Liberals has increased slightly (from 13% in June to 15%), while three per cent would cast a ballot for a Green Party candidate. Overall, 15 per cent of Manitoba adults are undecided or prefer not to say which party would earn their vote.
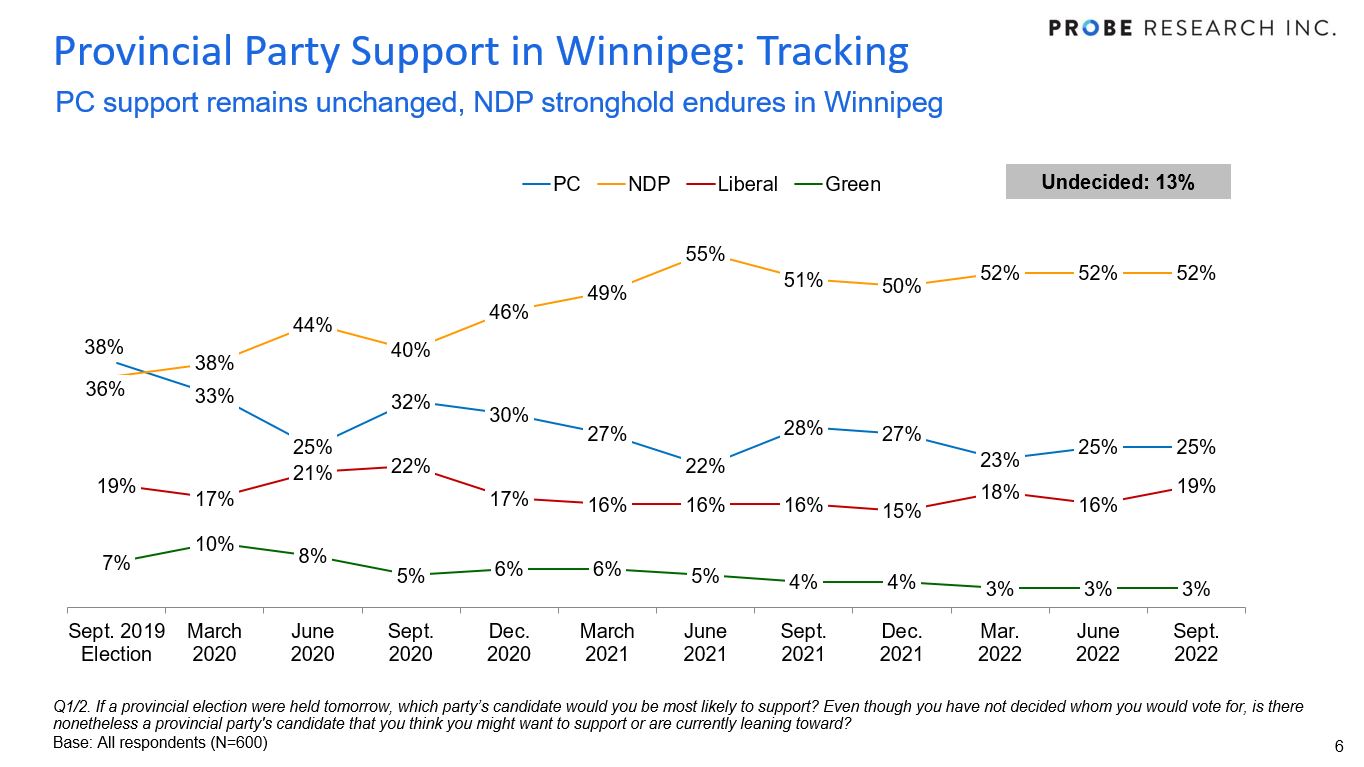
NDP support in Winnipeg has not moved for the past three soundings, as 52 per cent continue to prefer this party compared to just 25 per cent who would vote for a PC candidate (also unchanged). Support for the Manitoba Liberal party in Winnipeg has increased slightly (19%, +3 points). The NDP leads everywhere in Winnipeg, with its support strongest in the Core (60%) and weakest in northwest Winnipeg (42% vs. 28% PC and 27% Liberal). Outside Winnipeg, 55 per cent of decided and leaning voters remain partial to the PCs compared to 31 per cent who would vote for the NDP.
There is a clear gender gap apparent in terms of party support in Manitoba. Today, male voters tend to favour the PCs (46% vs only 34% of men who intend to vote NDP) Meanwhile, women in the province remain strongly aligned with the NDP (53% would vote NDP while only 27% favour the PCs). Also importantly, voters over 55 years of age are now almost equally divided in terms of support for the NDP (40%) and the PCs (39%).
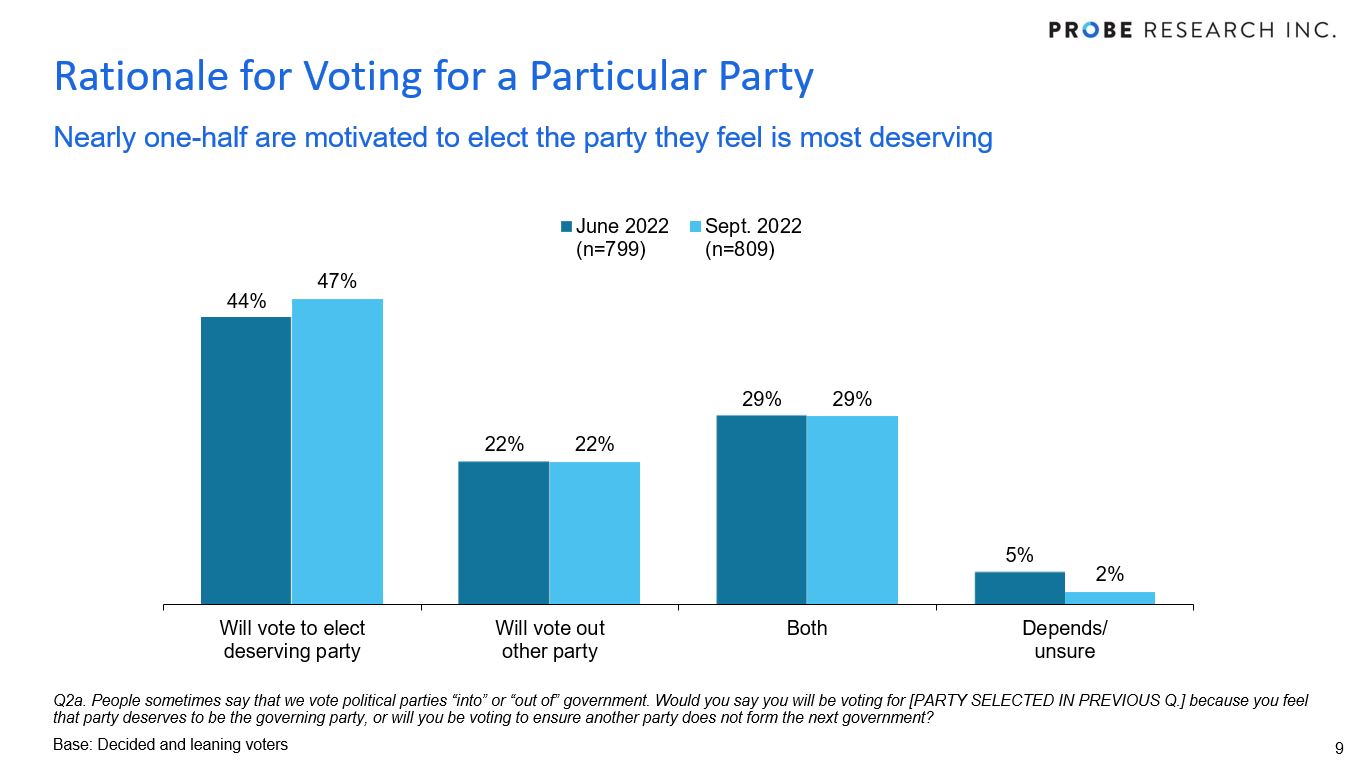
Manitobans remain mostly motivated to elect a party they consider to be deserving instead of voting out a party they oppose. Three in ten say they will cast a ballot to do both – to prevent a party from forming government and to support a party they favour. NDP voters are most likely to be motivated by these two factors, with more than one-half of PC and Liberal voters most likely to only make their choice on the basis of their preferred party.
About the Probe Research Omnibus
For more than two decades, Probe Research Inc. has undertaken quarterly omnibus surveys of random and representative samples of Manitoba adults. These scientific telephone surveys have provided strategic and proprietary insights to hundreds of public, private and not-for-profit clients on a range of social, cultural and public policy topics. The Probe Research Omnibus Survey is the province’s largest and most trusted general population survey.
Disclosure Statement
Probe Research is a member of the Canadian Research Insights Council (CRIC) and confirms that this research fully complies with all CRIC Standards including the CRIC Public Opinion Research Standards and Disclosure Requirements. Learn more at: https://www.canadianresearchinsightscouncil.ca/standards/por/
Methodology
Probe Research surveyed a random and representative sampling of 1,000 adults residing in Manitoba between September 8 and 18, 2022.
With a sample of 1,000, one can say with 95 per cent certainty that the results are within ± 3.1 percentage points of what they would have been if the entire adult population of Manitoba had been surveyed. The margin of error is higher within each of the survey’s population sub-groups.
The sample consists of 445 Manitobans randomly recruited via live-agent telephoned operator, 321 Manitobans randomly recruited via Interactive Voice Response (IVR) and 234 members of Probe Research's online panel. All respondents completed the survey on an online platform.
Modified random digit dialing, including both landline and wireless numbers, ensured all Manitoba adults had an equal opportunity to participate in this Probe Research survey.
Minor statistical weighting has been applied to this sample to ensure that age and gender characteristics properly reflect known attributes of the province’s population. All data analysis was performed using SPSS statistical analysis software.